In the Show you will get an overview of the (ransomware) status of systems you are monitoring. You only see the components where you are a member of the group with view rights.
There are three horizontal spaces for Alarm, Warning and OK status.
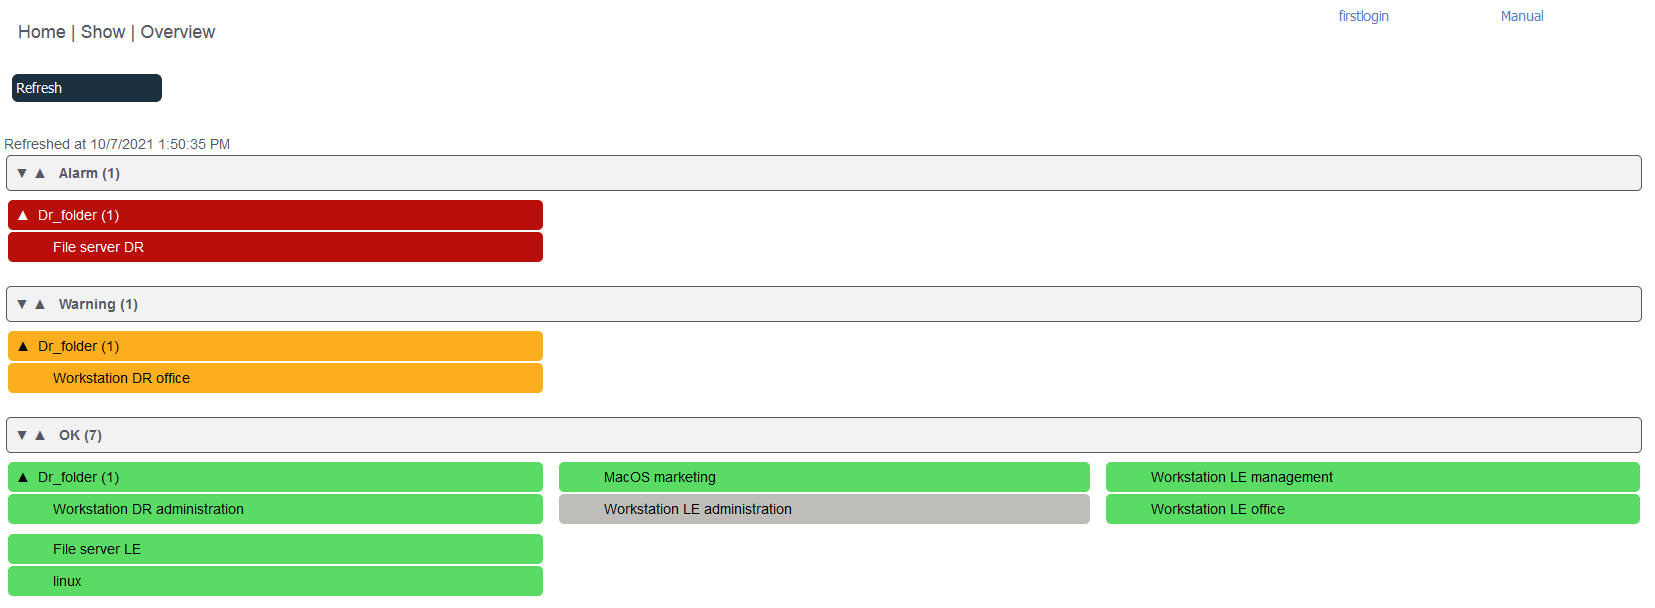
There are 4 different states:
•green: There is no ransomare behaviour activity at this moment
•yellow: There has been a warning notification f.i. concerning ransomware on your sensitive data
•red: There has been an alarm notification f.i. concerning ransomware on your sensitive data
•grey: The monitoring is off
When you click on a system that you are monitoring in the Show, you'll enter the details screen.
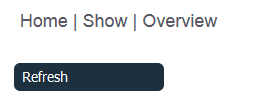
* The show will refresh in the set refresh rate, you can click on the Refresh button for an immediate update.
Hints:
* Your own refresh Rate can be changed at My settings / Application settings
* Add the Show to the dashboard as a Web site dashboard item